A Simple Tensorflow.js Sketch
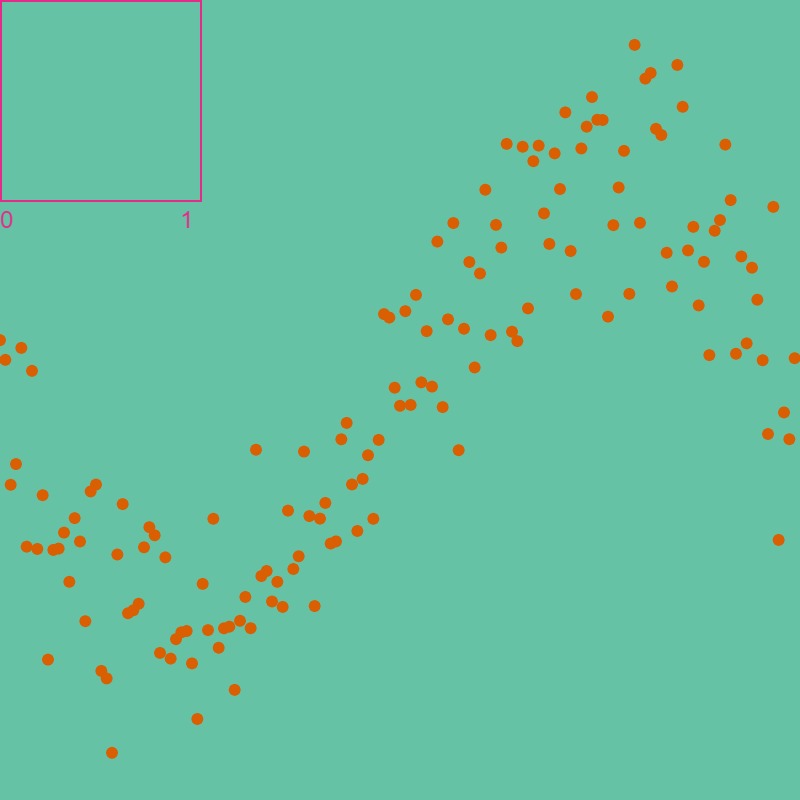
In this post I’m going to describe a p5.js sketch I’m working on to get familiar with tensorflow.js. A link to the sketch is at the end of this post, and the code is here. In this sketch, a small two-layer feed forward neural network learns to fit a curve to a set of two-dimensional points. I generate these points as random deviations from a sin curve:

The square in the top left will show a plot of the model’s loss as it trains. Here is the code to make the training set:
function makeTrainingPoints(numTrainingPoints) {
  let xs = [];
  let ys = [];

  for (let i = 0; i < numTrainingPoints; i ++) {
    let x = i / numTrainingPoints;
    let y = 0.5 + 0.3 * sin(TWO_PI * x) + randomGaussian(0, 0.08);
    xs.push([x]);
    ys.push([y]);
  }

  return [xs, ys];
}